Hanwha delivers transformative solutions that catalyze sustainable and shared growth through innovation and technology.
We build next-generation vessels and maritime technologies
that modernize fleets and strengthen energy and trade security.
We deliver integrated systems at speed and scale,
strengthening defense self-reliance across land, sea, air, and space.
Throughout the energy value chain,
we build integrated solutions that ensure reliable supply and meet rising demand.
Through digital platforms and global networks,
we expand access to capital and support long-term economic strength.
Across advanced manufacturing and intelligent automation,
we power high-precision production and accelerate industrial growth.
Energy & Maritime Solutions
Spanning solar, wind, hydrogen, and bridge solutions, we are strengthening
our clean energy value chain as we spearhead the journey towards net zero

Aerospace & Defense, Mechatronics
Our innovative technologies are fueling the new space era while making life
here at home safer, smarter, and better connected

Finance
Our financial solutions are tailored for every stage of life's journey, enriching
the lives of communities and the individuals that make them

Retail & Services
With specialized experiences that bring dreams to life, we are cultivating the
taste of the next generation of trendsetting, conscious consumers
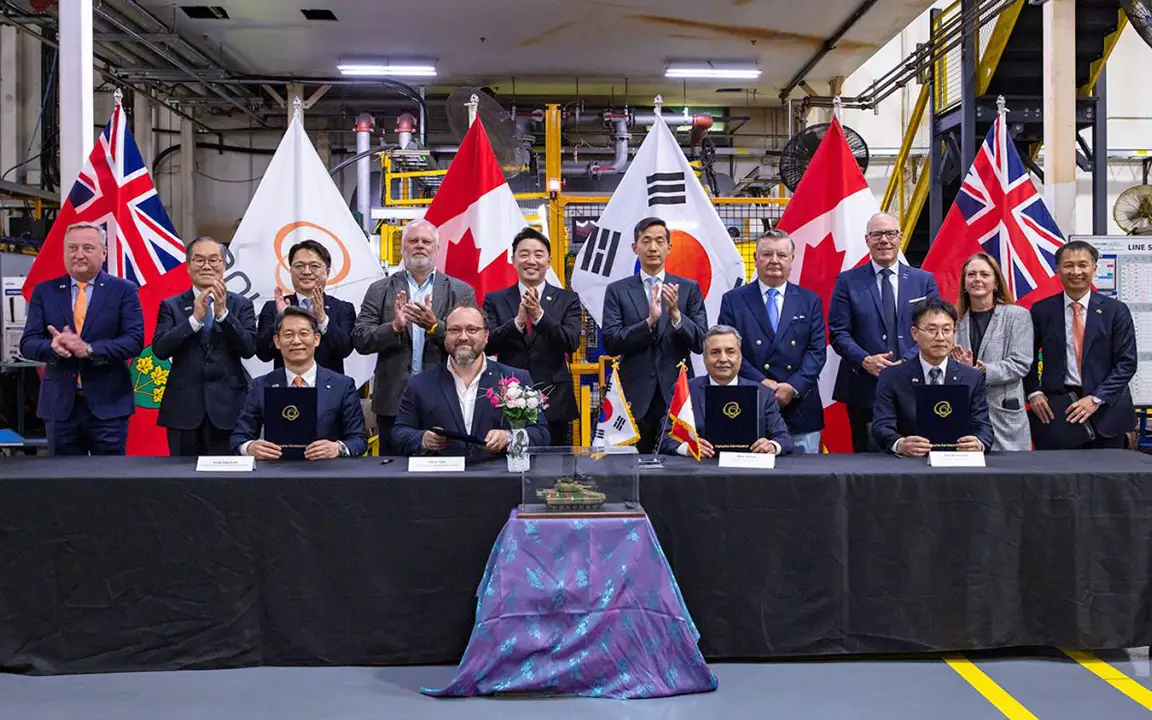
Newsroom


We deliver
the foundational systems
that secure societies
and strengthen industries
worldwide

Our Brand Purpose
A relentless commitment to sustainability drives
our bold innovation, allowing us to create
transformative solutions for individuals, society, and the planet
Our Brand Values


-
Sustainable and
Inclusive GrowthWe strive for social, economic, and
environmental prosperity for all


-
Technology and
Solution-driven InnovationThrough technological innovation,
we provide solutions from people to planet


-
Enhancing
LivesWe lay the foundation for a fulfilling life through
our technologies, products, and services
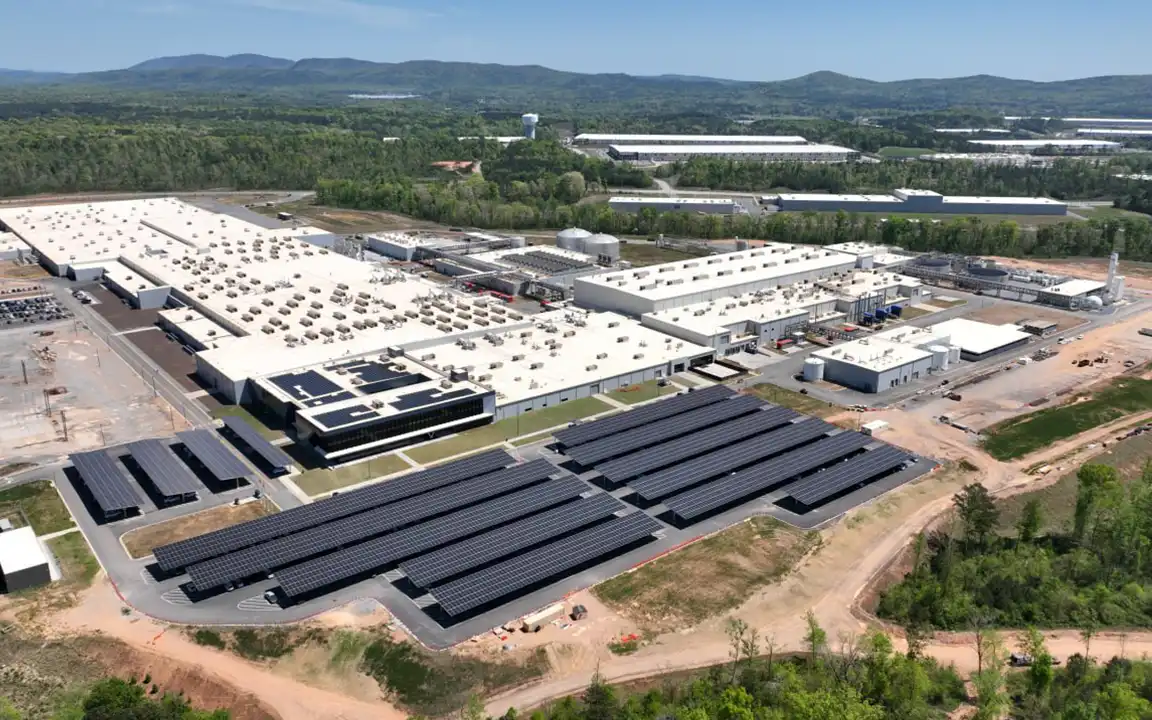
Global Reach,
Global Impact
Through strategic market expansion, collaboration,
and continued investment in advanced facilities
and manufacturing systems, we enhance efficiency,
increase output, and build long-term resilience